About Products (SCT and EVT)
Project Controls 365 brings all you need for project data analytics by plug and play integration of high in demand BI tool (Power BI) and most famous scheduling tool (Primavera P6). Both SCT and EVT serve distinct purposes and offer unique value in ensuring that your project remains well-informed and on track throughout its various stages.
Schedule Control Tool (SCT)
Earned Value Tool (EVT)
Supports non cost / resource loaded schedules
Basic Features
- Allows baseline and multiple updates comparison
- Allows all projects to be loaded at one place
- Supports WBS, activity codes, cost accounts
- Easy navigations with buttons and drill throughs
- Identify schedule changes across updates
- Traffic color coding for KPI monitoring
- Schedule forensic analysis
- Export PDF, PPT CSV
- Ideal for schedule control
Supports cost / resource loaded schedules
Basic Features
- Applicable for latest progress update
- Allows early and late curves for earned value KPIs
- Supports WBS, activity codes, cost accounts
- Easy navigations with buttons and drill throughs
- Allows whole portfolio to be loaded at one place
- Traffic color coding for KPI monitoring
- Descriptive earned value analysis
- Export PDF, PPT CSV
- Ideal for cost control
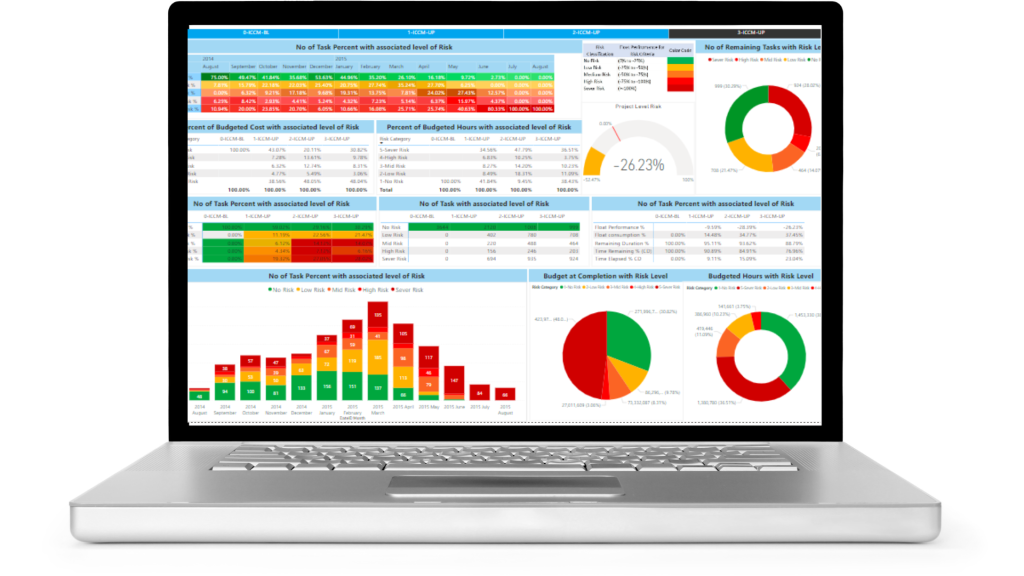
Schedule Control Tool
SCT is your day to day need for handling huge data in 90% efficient way. Works for non cost and resources loaded schedules. Allows comparison of baseline(s) and multiple updates. Identify approved/unapproved changes.
Schedule Control Tool provides 80+ highly interactive and enrich dashboards and reports of your P6 schedule.
Schedule Health Check
- DCMA-14 Points Health Check
- Dangling/Open start finish tasks
- Merge/diver task
- Out of sequence Task
- Clustered Predecessors
Task Tracking Analysis
- Task missing baseline dates
- Task hitting baseline dates
- Total planned task
- Unplanned progressed task
Baseline Compliance Analysis
- Early, On time and Late started task
- Early OT and Late to be started task
- Descriptive compliance to BL dates
- Predictive compliance to BL dates
Float Consumption Analysis
- Baseline vs current total float
- Float consumption to date
- BL vs Current float per day
- Float Performance analysis
Look ahead Plans
- 7, 14 30 & 60 Day lookahead Plan
Float Consumption Analysis
- Compare Baseline with updates
- Identify changes across all updates
- Analyze historic trends of changes
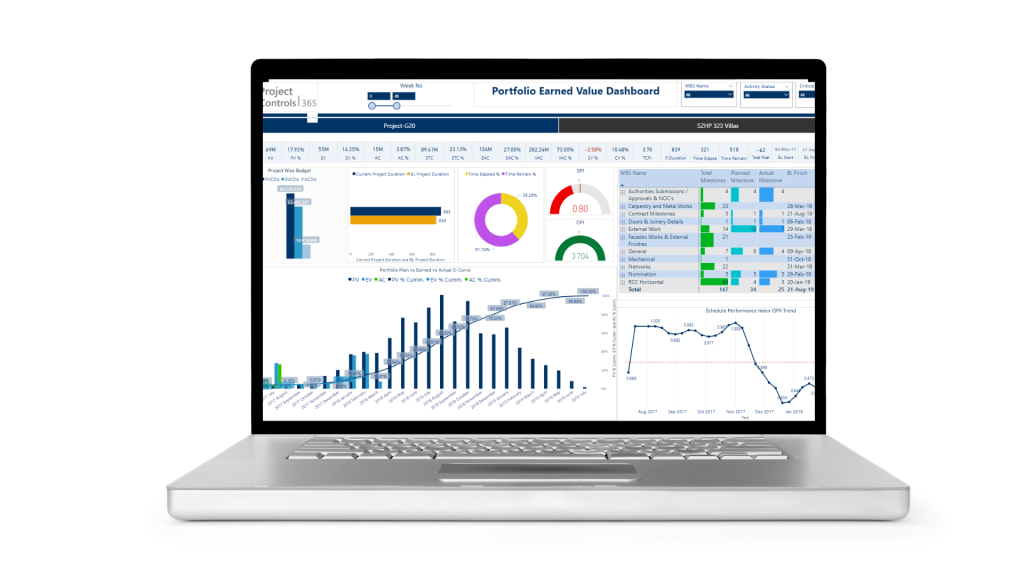
Earned Value Tool
EVT is your day to day need for handling huge data in 90% efficient way. Works for only cost and/or resources loaded schedules. Allows single and multiple projects upload. Applicable for integration with financial and accounting system
Earned Value S Curves
- Cost and hours-based S curves
- Activity Codes based S curves
- Weekly, Monthly, Yearly S curve
- Multiple projects S curve
- Early vs Late S curve for activity codes and multiple projects
Schedule Health Check
Earned Value Tool provides 90+ highly interactive and enrich dashboards and reports of your P6 schedule. It allows to integrate with any ERP system for cost control
Early vs Late Earned Value Analysis
- Early vs Late planned value
- Early vs Late SV & SPI visuals, trends
- Early vs Late planned value S curve
- Early vs late cost and hours spreadsheet and matrix view
Schedule Variance and SPI Trends
- Traffic color coding for SV & SPI
- SV and SPI period and cum. trends
- SV and SPI spreadsheet view
- Early and Late SV and SPI trends
- SV & SPI drill down to task, wbs or activity code level
Lookahead Plans
- 7,14,30 & 60 days lookahead plan
- Lookahead task with plan value
- Lookahead with remaining resr.
- Lookahead with early vs late value
- Lookahead with resource and trade type
Resource Monitoring
- Resource assignment spreadsheet
- Trade wise resource histograms
- Early vs late trade wise resource
- Budget, remaining, actual, at completion resource view
DCMA-14-Point Features
| DCMA Metric | Count/Sum | Percent / Index | Drill Down | Descriptive Trend | Change Comparison | Predictive Trend |
|---|---|---|---|---|---|---|
|
Missing Logic
|
✔ |
✔ |
✔ |
✔ |
✔ |
✔ |
|
Leads
|
✔ |
✔ |
✔ |
✔ |
✔ |
✔ |
|
Lags
|
✔ |
✔ |
✔ |
✔ |
✔ |
✔ |
|
Relationship types
|
✔ |
✔ |
✔ |
✔ |
✔ |
✔ |
|
Constraints
|
✔ |
✔ |
✔ |
✔ |
✔ |
✔ |
|
High float task
|
✔ |
✔ |
✔ |
✔ |
✔ |
✔ |
|
Negative Float task
|
✔ |
✔ |
✔ |
✔ |
✔ |
✔ |
|
High duration task
|
✔ |
✔ |
✔ |
✔ |
✔ |
✔ |
|
Invalid dates
|
✔ |
✔ |
✔ |
✔ |
✔ |
N/A |
|
Missing resources
|
✔ |
✔ |
✔ |
✔ |
✔ |
✔ |
|
Hit task
|
✔ |
✔ |
✔ |
✔ |
✔ |
N/A |
|
Miss task
|
✔ |
✔ |
✔ |
✔ |
✔ |
N/A |
|
Critical task
|
✔ |
✔ |
✔ |
✔ |
✔ |
✔ |
|
Critical path length Index
|
N/A |
✔ |
✔ |
✔ |
✔ |
✔ |
|
Baseline execution index
|
N/A |
✔ |
✔ |
✔ |
✔ |
N/A |
Earned Value Features
| EVM Metric | Sum | Percent / Index | Drill Down | Descriptive Trend | Change Comparison | Predictive Trend |
|---|---|---|---|---|---|---|
|
Budget at Completion
|
✔ |
✔ |
✔ |
✔ |
✔ |
✔ |
|
Planned Value cost
|
✔ |
✔ |
✔ |
✔ |
✔ |
✔ |
|
Earned Value
|
✔ |
✔ |
✔ |
✔ |
✔ |
N/A |
|
Schedule Variance
|
✔ |
✔ |
✔ |
✔ |
✔ |
N/A |
|
SPI
|
N/A |
✔ |
✔ |
✔ |
✔ |
N/A |
|
CPI
|
* |
* |
* |
* |
* |
* |
|
Cost Variance
|
* |
* |
* |
* |
* |
* |
|
Estimate at Completion
|
* |
* |
* |
* |
* |
* |
|
Estimate to Complete
|
* |
* |
* |
* |
* |
* |
|
Variance at Completion
|
* |
* |
* |
* |
* |
* |
|
TCPI
|
* |
* |
* |
* |
* |
* |
Task Tracking Features
| Task Tracking Metric | Count/Sum | Percent / Index | Drill Down | Descriptive Trend | Change Comparison | Predictive Trend |
|---|---|---|---|---|---|---|
|
Planned to Finish
|
✔ |
✔ |
✔ |
✔ |
✔ |
N/A |
|
Planned Value cost
|
✔ |
✔ |
✔ |
✔ |
✔ |
N/A |
|
Planned to Start
|
✔ |
✔ |
✔ |
✔ |
✔ |
N/A |
|
Un-Planned Finished
|
✔ |
✔ |
✔ |
✔ |
✔ |
N/A |
|
Un-Planned Started
|
✔ |
✔ |
✔ |
✔ |
✔ |
N/A |
|
Actual Finished
|
✔ |
✔ |
✔ |
✔ |
✔ |
N/A |
|
Actual Started
|
✔ |
✔ |
✔ |
✔ |
✔ |
N/A |
|
Variance to Finished
|
✔ |
✔ |
✔ |
✔ |
✔ |
N/A |
|
Variance to Started
|
✔ |
✔ |
✔ |
✔ |
✔ |
N/A |
Baseline Compliance and Float Risk Features
| BSC & FRA Metric | Count/Sum | Percent / Index | Drill Down | Descriptive Trend | Change Comparison | Predictive Trend |
|---|---|---|---|---|---|---|
|
Started Early
|
✔ |
✔ |
✔ |
✔ |
✔ |
N/A |
|
Started on Time
|
✔ |
✔ |
✔ |
✔ |
✔ |
N/A |
|
Started Late
|
✔ |
✔ |
✔ |
✔ |
✔ |
N/A |
|
Finished Early
|
✔ |
✔ |
✔ |
✔ |
✔ |
N/A |
|
Finished on Time
|
✔ |
✔ |
✔ |
✔ |
✔ |
N/A |
|
Finished Late
|
✔ |
✔ |
✔ |
✔ |
✔ |
N/A |
|
To Start Early
|
✔ |
✔ |
✔ |
✔ |
✔ |
✔ |
|
To Start on Time
|
✔ |
✔ |
✔ |
✔ |
✔ |
✔ |
|
To Start Late
|
✔ |
✔ |
✔ |
✔ |
✔ |
✔ |
|
To Finish Early
|
✔ |
✔ |
✔ |
✔ |
✔ |
✔ |
|
To Finish on Time
|
✔ |
✔ |
✔ |
✔ |
✔ |
✔ |
|
To Finish Late
|
✔ |
✔ |
✔ |
✔ |
✔ |
✔ |
|
Descriptive Compliance
|
✔ |
✔ |
✔ |
✔ |
✔ |
N/A |
|
Predictive Compliance
|
✔ |
✔ |
✔ |
✔ |
✔ |
✔ |
|
Float Consumption
|
N/A |
✔ |
✔ |
✔ |
✔ |
✔ |
|
Float Performance
|
N/A |
✔ |
✔ |
✔ |
✔ |
✔ |
|
BL Float per Day
|
N/A |
✔ |
✔ |
✔ |
✔ |
✔ |
|
Current Float per Day
|
N/A |
✔ |
✔ |
✔ |
✔ |
✔ |
|
Float Consumption Limit
|
N/A |
✔ |
✔ |
✔ |
✔ |
✔ |
Some Key Metrics Features
| Key Metric | Count/Sum | Percent / Index | Drill Down | Descriptive Trend | Change Comparison | Predictive Trend |
|---|---|---|---|---|---|---|
|
Actual Start
|
✔ |
✔ |
✔ |
✔ |
✔ |
N/A |
|
Actual Finish
|
✔ |
✔ |
✔ |
✔ |
✔ |
N/A |
|
Baseline Start
|
✔ |
✔ |
✔ |
✔ |
✔ |
N/A |
|
Baseline Finish
|
✔ |
✔ |
✔ |
✔ |
✔ |
N/A |
|
Current Start
|
✔ |
✔ |
✔ |
✔ |
✔ |
N/A |
|
Current Finish
|
✔ |
✔ |
✔ |
✔ |
✔ |
N/A |
|
BL Variance S+F
|
✔ |
✔ |
✔ |
✔ |
✔ |
✔ |
|
Total Float
|
✔ |
✔ |
✔ |
✔ |
✔ |
✔ |
|
Original Duration
|
✔ |
✔ |
✔ |
✔ |
✔ |
✔ |
|
Remaining Duration
|
✔ |
✔ |
✔ |
✔ |
✔ |
✔ |
|
At Completion Duration
|
✔ |
✔ |
✔ |
✔ |
✔ |
✔ |
|
Actual Duration
|
✔ |
✔ |
✔ |
✔ |
✔ |
✔ |
|
Baseline Duration
|
✔ |
✔ |
✔ |
✔ |
✔ |
N/A |
|
Out of Sequence Task
|
✔ |
✔ |
✔ |
✔ |
✔ |
✔ |
|
Near Critical Task
|
N/A |
✔ |
✔ |
✔ |
✔ |
✔ |
|
Loss of Near Critical Task
|
N/A |
✔ |
✔ |
✔ |
✔ |
✔ |
|
Far Critical Task
|
N/A |
✔ |
✔ |
✔ |
✔ |
✔ |
|
High Float Task
|
N/A |
✔ |
✔ |
✔ |
✔ |
✔ |
|
Low Negative Float
|
N/A |
✔ |
✔ |
✔ |
✔ |
✔ |
|
Mid Negative Float
|
✔ |
✔ |
✔ |
✔ |
✔ |
✔ |
|
High Negative Float
|
✔ |
✔ |
✔ |
✔ |
✔ |
✔ |
|
Relationship Density
|
✔ |
✔ |
✔ |
✔ |
✔ |
✔ |
|
Dangling Start
|
✔ |
✔ |
✔ |
✔ |
✔ |
✔ |
|
Dangling Finish
|
✔ |
✔ |
✔ |
✔ |
✔ |
✔ |
|
Total Dangling
|
✔ |
✔ |
✔ |
✔ |
✔ |
✔ |
|
Merge Path
|
✔ |
✔ |
✔ |
✔ |
✔ |
✔ |
|
Diverge Path
|
✔ |
✔ |
✔ |
✔ |
✔ |
✔ |
|
Merge Hotspot
|
✔ |
✔ |
✔ |
✔ |
✔ |
✔ |
Start Creating Value for your teams by Interacting with our Dashboard Templates
How it Works
Our unique method of integration is fully capable of applying EVM on your 2D. Our team can integrate your DWG files with Primavera P6 schedule, and Financial System, using Power BI data modelling.


What are the Take Aways?
Our Templates
Try Out our interactive templates below
These templates are ready for integration with your schedule data.
Schedule Development
We provide project teams, including contractors and subcontractors, with targeted lean construction training modules and coaching to equip them with the right skills to ensure sustainability of lean efforts throughout execution.
Scheduling Maintenance
Our hands-on scheduling experts can provide remote schedule updates, on a weekly, monthly or as-needed basis. We can also provide full-time project scheduling services if needed

Scheduling: Gap Analysis